Case Study
TapTools
Helping users of a live analytics platform find the number they came for
- Client
- TapTools Token and NFT analytics platform, USA
- My role
- Senior Product Designer With a product and engineering team of about ten
- Timeline
- Dec 2022 – Jun 2023
- Scope
- Research, testing, core-flow redesign, production UI
- Industry
- Fintech analytics Web dashboard
- Markets
- Global, remote from the USA
Overview
TapTools gave Cardano traders token and NFT market data through market overviews, token pages, portfolios, swaps, watchlists and a wallet profiler. The data was rich. People were getting lost in it.
I led user research and testing, redesigned the core flows and took the interface from early layouts to production-ready screens with a product and engineering team of about ten.
Key impact
User-reported issues down 23% within 60 days · Core flows redesigned and shipped to a live product
The problem
Everything at the same volume
TapTools was live and busy. A token page held a chart, pool data, a watchlist, top movers and every recent trade, all at the same weight. Research and testing showed people stalling in the core flows, scanning for the number they came for and leaving before they finished.
The redesign had to land on a product people used every day. It had to fix the order of things without moving where people expected to find them.
I treated it as a hierarchy problem. Users didn’t need more data. They needed to see the right number first.
The structure
One hub, and one structure for every wallet
I mapped every feature against how people moved between them. The market overview became the hub, and every other area sits one click from it.
The biggest call was to give your own wallets and anyone else’s the same structure. The portfolio and the wallet profiler share one set of tabs, so learning one teaches the other, and engineering builds one set of components.
Swap closes the loop. When a swap finishes, it sends you back to your portfolio, where the result shows.
From a number to a wallet
Every trade has a wallet behind it
Cardano traders want to know who is buying, and following that trail shouldn’t mean leaving the page.
I tagged every trade with the size of the wallet behind it, from shrimp to whale, and made the tag open a preview beside the chart. The token stays in view while you check the trader. The full profile is one more click.
The profiler reads a wallet like a person. It shows what the wallet holds, when it trades and who funded it.
The portfolio
Answer ‘how am I doing?’ first
Early versions gave the list of wallets as much room as the money. Over three passes the list became a switcher in the header, and the value and the chart took the width.
Above the chart sit the answers a holder wants first: all-time profit, the best and worst performer, and staking income. The tables come after.
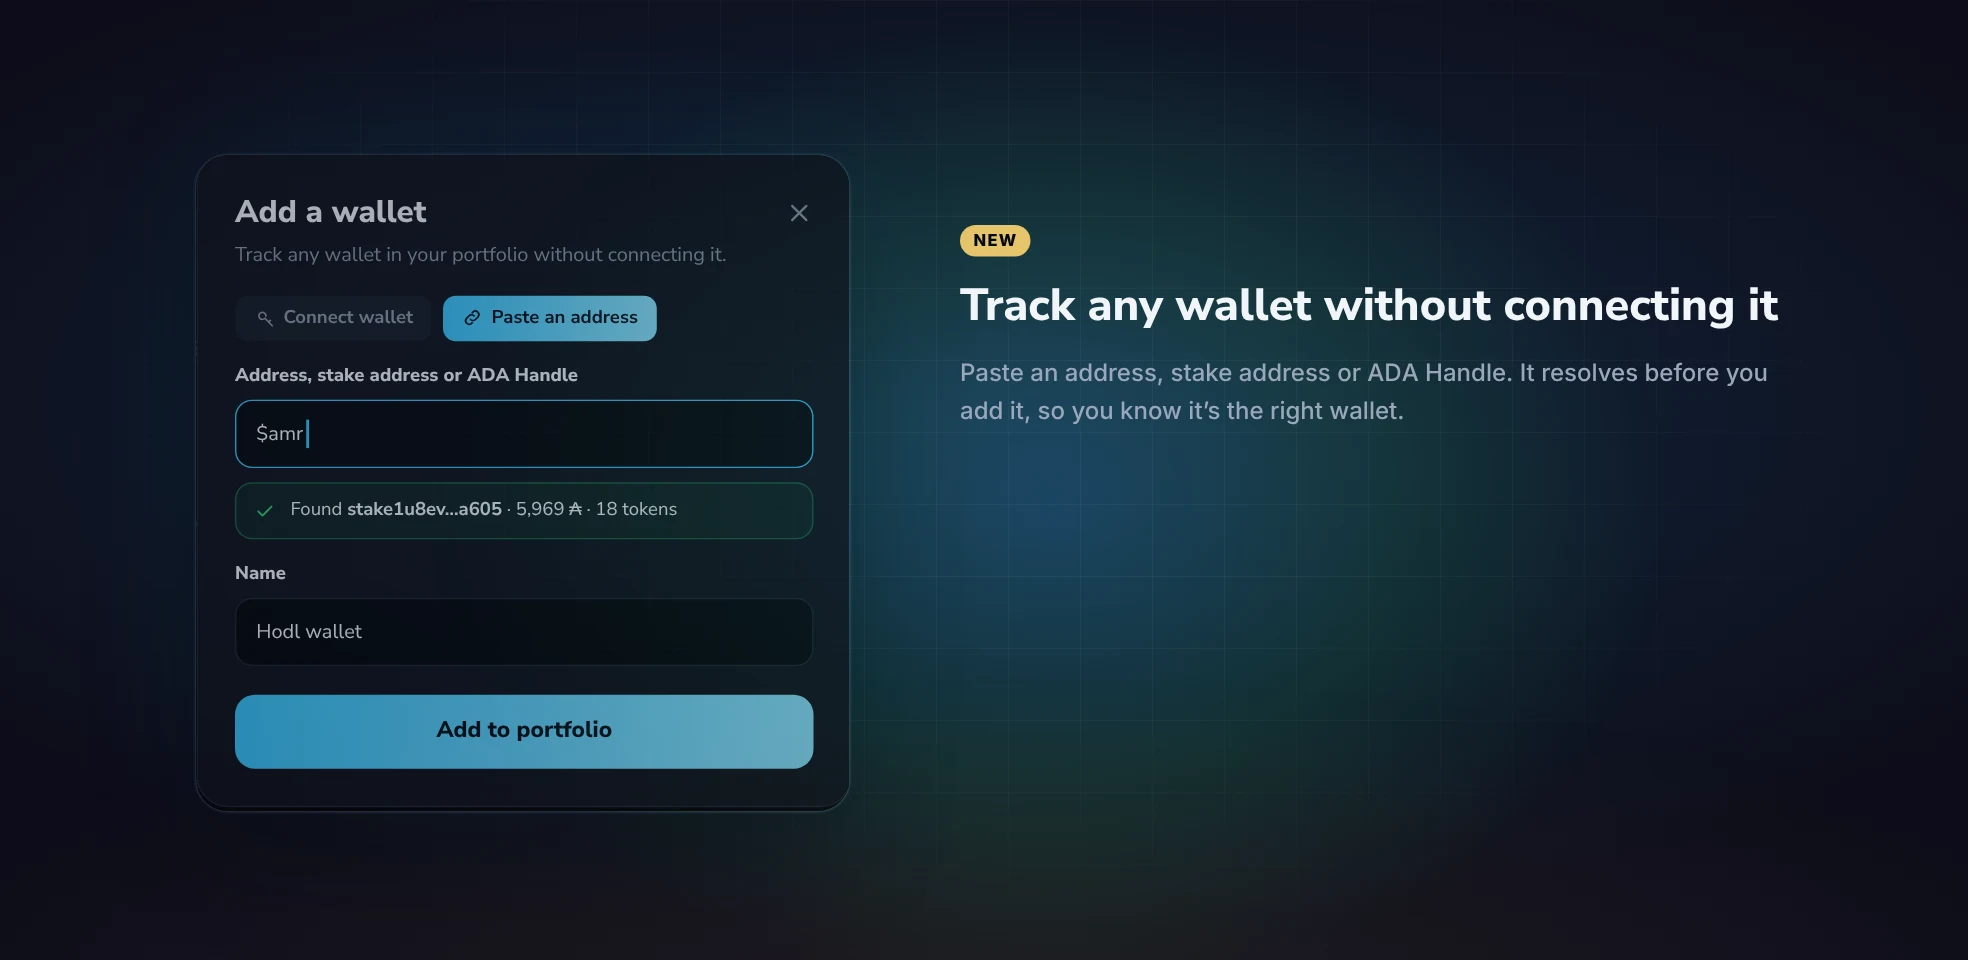
Tracking a wallet shouldn’t need a wallet connection. You can add any address, stake address or ADA Handle, check that it resolves and give it a name.
The swap
Swap without surprises
TapSwap routes trades across Cardano exchanges for two kinds of trader. Simple mode is one card. Nerd mode adds the chart, the route, slippage, price impact and fees.
Anyone can mint a token with any name, so unlisted tokens stop you once. Going back is the main button, and the policy ID is there to check. Regular traders can switch the warning off for a token they know.
Every state has a screen, from picking a token to a failed swap that says why it failed and how to fix it.
Shipping it
One dark system for dense data
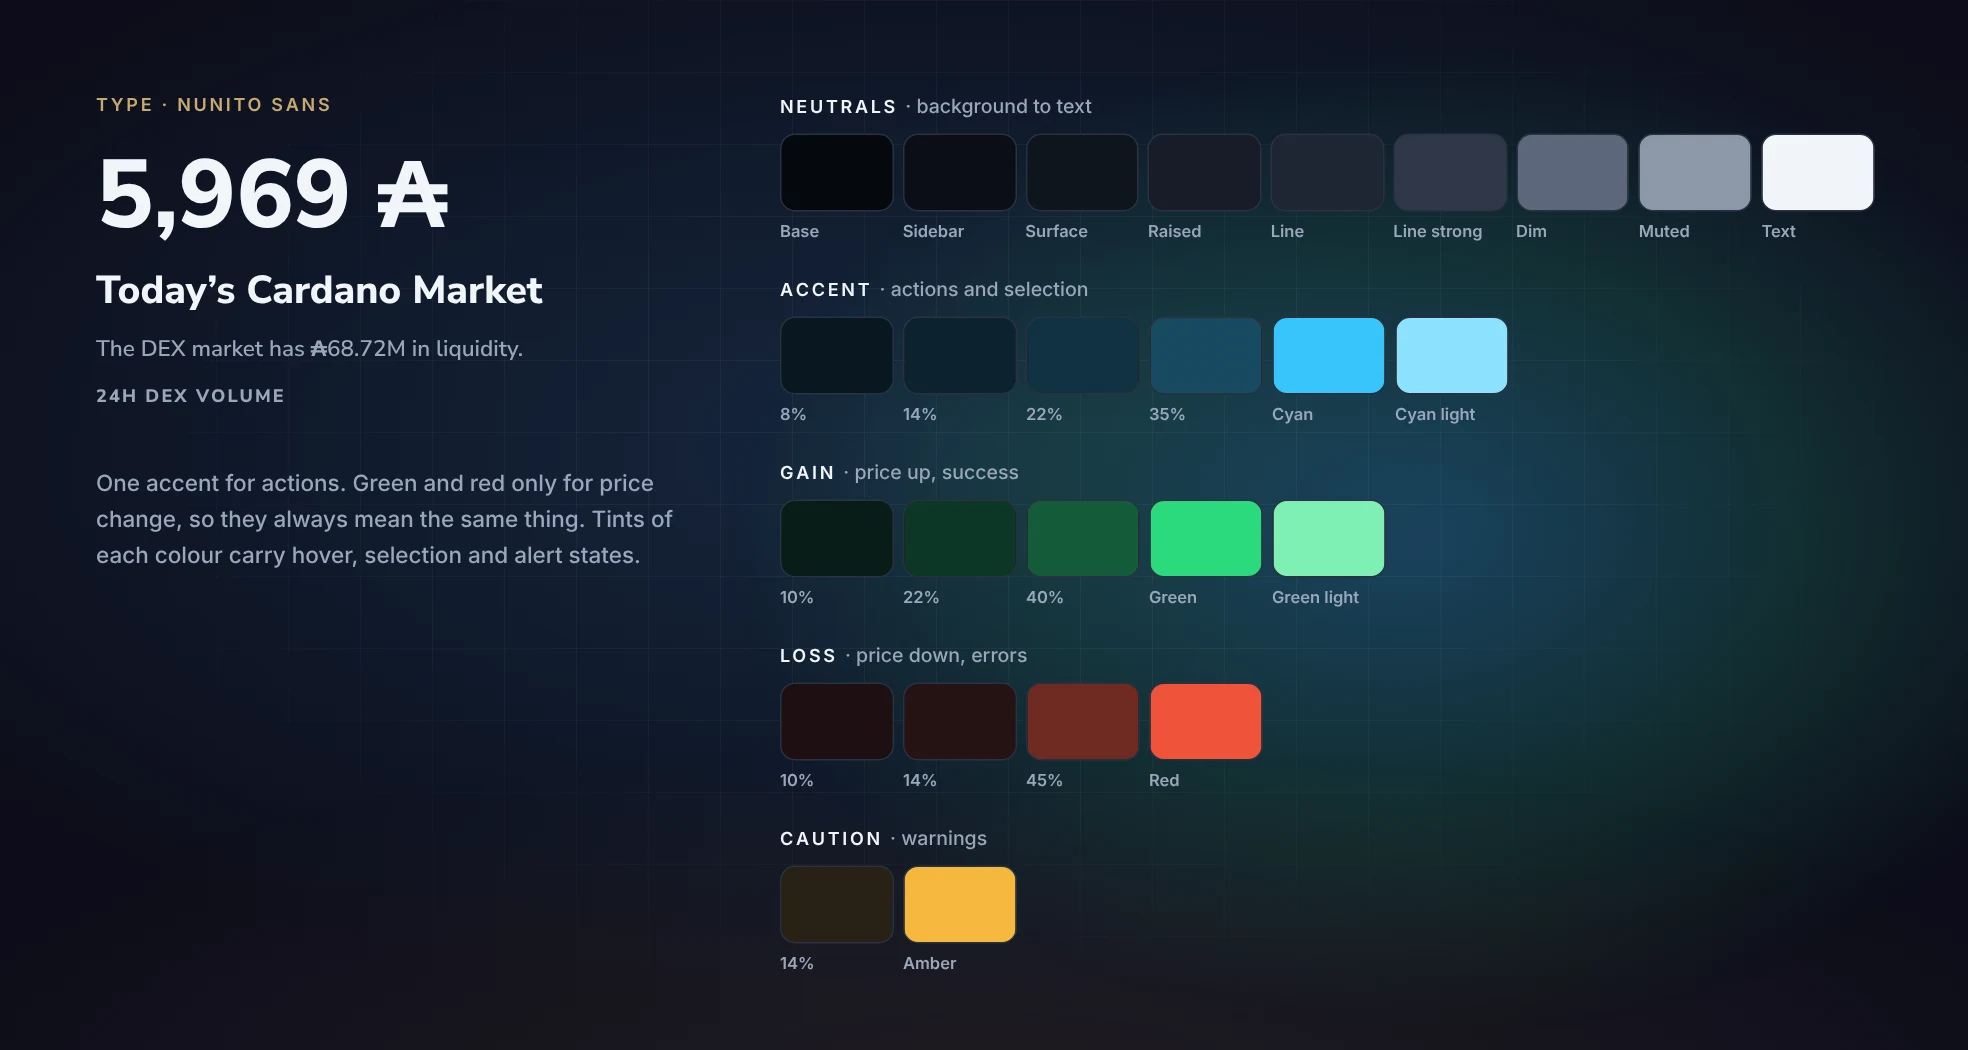
I designed one dark system for dense data. One typeface with tabular numbers, one accent for actions, and green and red kept for price change.
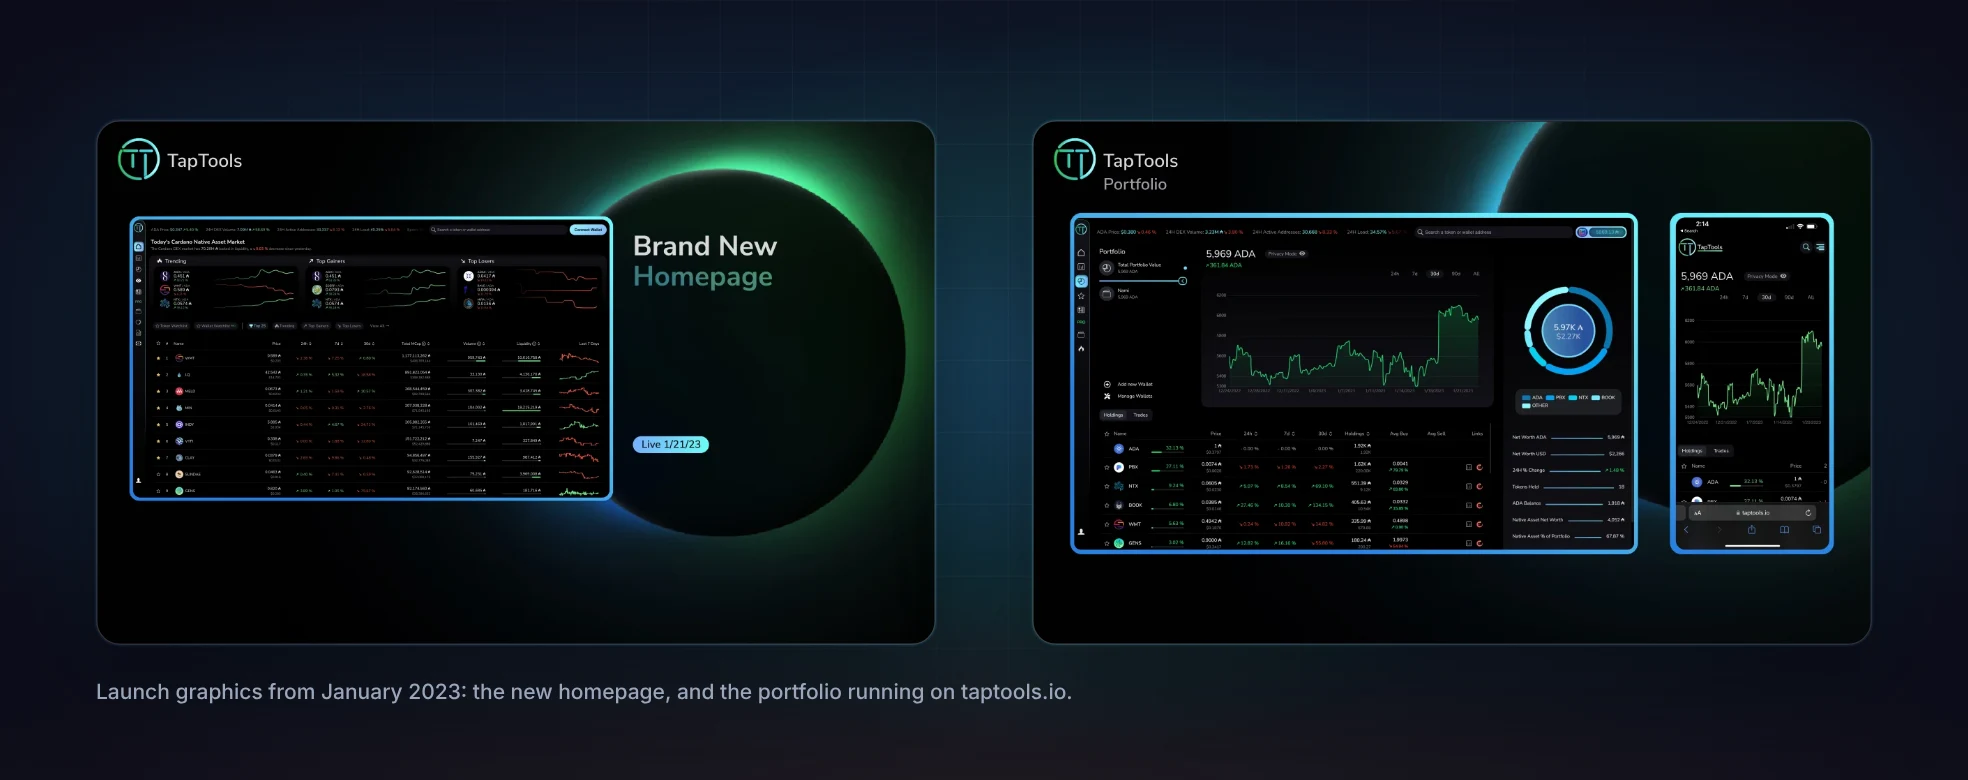
I worked with a product and engineering team of about ten to move the redesign into the live product. The new homepage and chart interface went live on 21 January 2023, followed by the portfolio and the wallet profiler.
What Changed
- User-reported issues fell by 23% within 60 days of launch, measured through support tickets and reports from the community on Discord and X
- New homepage and chart interface live from 21 January 2023
- Core analytics flows redesigned around a clearer hierarchy
- Part of the wider product work that preceded the company’s next funding round
Looking Back
In an analytics product, more information doesn’t help if people can’t find the number they need. The work began with understanding where users were getting stuck, then carried that understanding through the interface and into production.
UX Research & Product Design: Amr Abu-Talleb